![]()
Enabling digital transformations in industries and a society

4.Analysis
International Comparative Study Report on Open Source Software Publication Activities by Governments
4.1 Purpose and Overview of the Analysis
Based on the data collected in Chapter 3, this chapter aims to identify characteristics of open-source software (OSS) activities within national governments. We collected statistics on publicly available repositories and contributions on GitHub, along with OSS-related policies from external data sources for each country and presented the results of observing the relationship between these two sets of data.
It should be noted that due to the limitations of the collected data and the absence of qualitative research such as organizational interviews, discrepancies between these analysis results and actual activities are anticipated. However, sufficient information has been gathered to present these findings as hypotheses for future research and policy discussions. Therefore, this chapter provisionally presents the analysis results based on the collected data.
This chapter presents analysis results based on three perspectives: "number of activities," "time axis," and "technology field." Analysis 1 organizes the scale (activity level) and maturity of OSS disclosure activities within public institutions in each country, as well as other characteristics revealed by the data, based on country-specific aggregated results from the collected data. Analysis 2 then focuses on the temporal changes in the number of OSS releases. It clarifies the process of these changes using the number of OSS releases organized chronologically. Furthermore, it identifies policies formulated and government movements occurring around the timing of these changes, presenting them as hypotheses for events that may have influenced OSS release activities. The relationship between policy and OSS disclosure activities is presented as an observation of contemporaneous trends; no causal assertions are made. Analysis 3 attempts to classify the collected data by technology field to identify trends. Note that this analysis is purely exploratory and descriptive, without statistical verification.
4.2 Analysis 1: Number of OSS Releases by Country
4.2.1 Data Overview
The analysis in this chapter is based on GitHub activity data acquired between September and October 2025. Tables 4-1 and 4-2 present key metrics for each country's OSS activity (number of repositories, stars, forks, branches, issues, pull requests, contributors, and organizations). This data provides a foundation for comparing the activity levels, developer community maturity, and organizational structures of OSS initiatives across countries.
| Country
|
Number of Repositories
|
Stars
|
Fork Count
|
Branches
|
|---|---|---|---|---|
| Japan
|
626
|
6214
|
1658
|
1863
|
| Estonia
|
196
|
1333
|
819
|
937
|
| Singapore
|
483
|
2869
|
1113
|
5835
|
| Germany
|
276
|
12911
|
2657
|
1752
|
| France
|
2359
|
23622
|
8723
|
28100
|
| United Kingdom
|
16058
|
74112
|
34051
|
214172
|
| United States
|
10300
|
206907
|
86611
|
93257
|
| Country
|
Number of Issues
|
Pull Request Count
|
Number of Contributors
|
Number of Organizations
|
|---|---|---|---|---|
| Japan
|
1204
|
3801
|
4359
|
22
|
| Estonia
|
1058
|
6050
|
1464
|
6
|
| Singapore
|
5137
|
34608
|
6008
|
5
|
| Germany
|
6239
|
39411
|
3141
|
8
|
| France
|
64501
|
238886
|
22875
|
25
|
| United Kingdom
|
86241
|
1903128
|
160810
|
30
|
| United States
|
239529
|
542434
|
73764
|
71
|
4.2.2 Activity Level and Maturity
The activity level of OSS efforts and the maturity of improvement cycles vary significantly by country.
The UK stands out in both activity and maturity of improvement activities, recording 16,058 repositories and approximately 1.9 million pull requests.
The United States also demonstrates high maturity with 10,300 repositories and over 500,000 pull requests.
France recorded approximately 240,000 pull requests across 2,359 repositories, indicating active improvement efforts despite its medium scale.
Germany has 276 repositories and approximately 39,000 pull requests, characterized by intensive activity related to security and digital sovereignty.
Singapore has 483 repositories and approximately 34,000 pull requests, showing strong activity in smart city-related areas.
Japan has 626 repositories with approximately 3,800 pull requests, while Estonia has 196 repositories with approximately 6,000 pull requests. Although smaller in scale, both show concentrated improvements in specific areas.
These differences may stem from variations in policy implementation, timing and administrative structures.
4.2.3 Characteristics of National Activities Seen Through Repositories and Pull Requests
Figures 4-1 and 4-2 illustrate the relationship between the horizontal axis (number of repositories, indicating activity level) and the vertical axis (number of pull requests, indicating developer community maturity) in OSS activities by national governments.
(Figure 4-2 is an enlarged view of the lower-left area of Figure 4-1)
Overall, the UK and US stand out. The UK recorded over 1.9 million pull requests for approximately 16,000 repositories, indicating very high activity scale (activity level) and developer community maturity. The US also demonstrated strong activity in both scale and improvement cycles, with over 500,000 pull requests for approximately 10,000 repositories.
France, with around 2,300 repositories and over 200,000 pull requests, exhibits active improvement despite its medium scale.
Conversely, Japan, Estonia, Singapore, and Germany have repository counts in the hundreds and pull request counts below tens of thousands, but their activity is characterized by concentration in specific fields. Notably, Germany and Singapore have a high number of pull requests relative to their repository counts, indicating a lean, high-quality improvement cycle.
This comparison suggests that the "activity level" and "maturity" of OSS activities reflect different approaches by country, likely influenced by differences in policy and organizational structure.
Next, we will comprehensively compare multiple metrics—including repository count, pull request count, star count, fork count, branch count, issue count, and contributor count—to analyze the structural characteristics of OSS activities in each country.
-
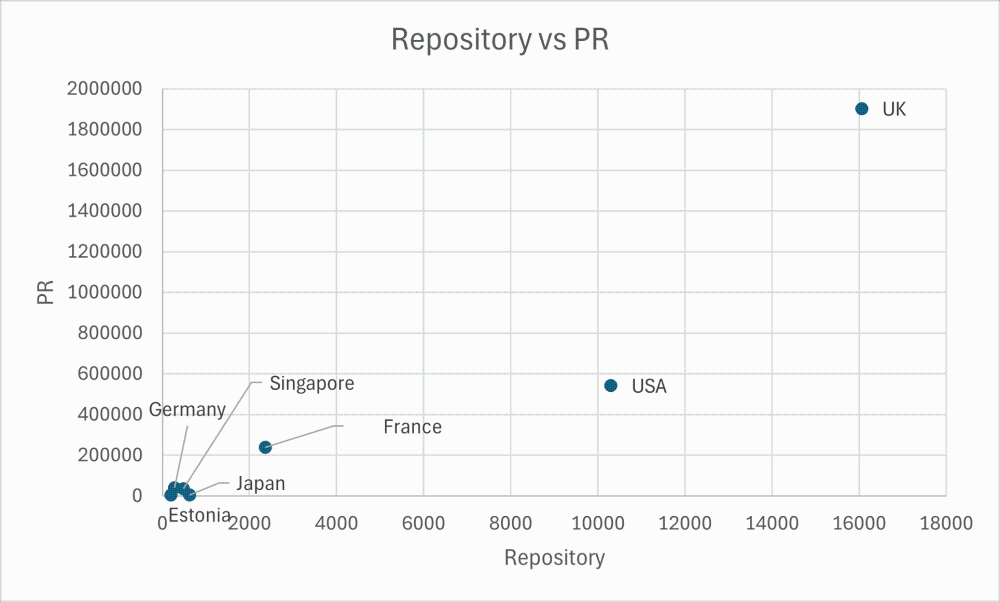
Figure 4-1 Repository Count and Pull Request Count (7-Country Comparison)
-
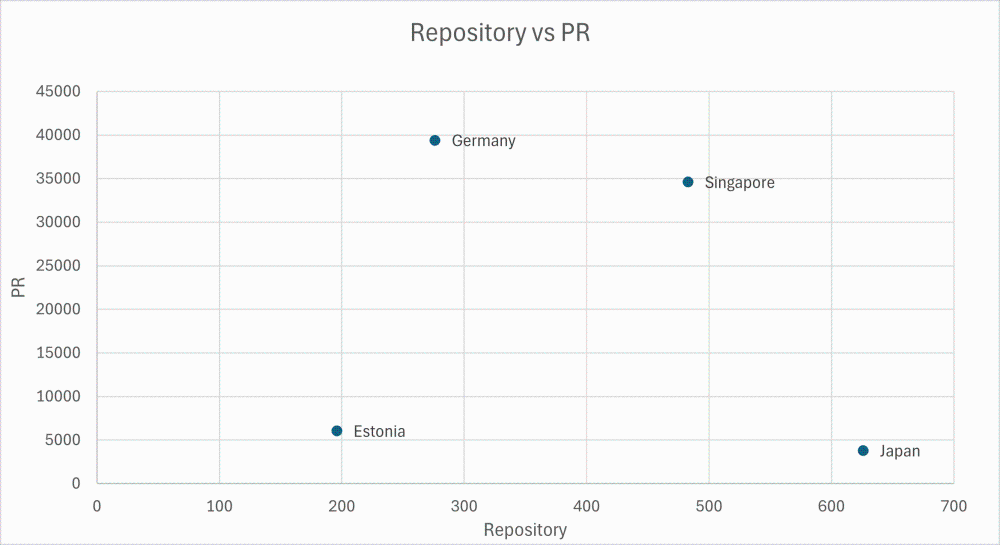
Figure 4-2 Repository Count and Pull Request Count (4-Country Comparison)
4.2.4 Characteristics of Each Country Based on Key Indicators
Figures 4-3 and 4-4 are radar charts comparing key indicators. To create these radar charts, each indicator was normalized using its maximum value as the baseline. The absolute values of each indicator vary significantly in magnitude, making direct comparison difficult. Furthermore, since the theoretical maximum value for each indicator is unknown, normalizing within the observed data range is more reasonable than comparing absolute values. Therefore, by setting the maximum value for each item to 1.0 and representing other countries as ratios relative to this, it became possible to show relative relationships. This method eliminates scale differences between items, enabling comparison across all indicators. As an example of normalization, Japan's normalized value for repositories is calculated as Japan's repository count (626) divided by the UK's repository count (16,058) (626/16,058).
Comparing OSS activities by government organizations across countries using metrics such as repository count, star count, fork count, branch count, issue count, pull request count, and contributor count revealed significant differences in activity scale (activity level) and maturity of the improvement cycle.
The UK and US stand out across all metrics, leading the world in both the scale (activity level) and maturity of their OSS activities. The UK recorded 16,058 repositories and approximately 1.9 million pull requests. Despite having a relatively small number of organizations (30), it is likely to employ a centralized, large-scale open-source strategy. The US, meanwhile, has 10,300 repositories and overwhelming numbers of stars and forks, suggesting it holds numerous OSS projects with high international usage and visibility.
France, while medium-sized, exhibits highly active improvement efforts. With approximately 240,000 pull requests and 64,501 issues recorded across 2,359 repositories, it demonstrates a strong user-participation-driven improvement culture and high maturity in collaborative development.
Germany has a low number of repositories but a high volume of pull requests. This structure indicates a focus on investing resources into a small number of key projects, aligning with its policy emphasis on security and digital sovereignty-related development.
Singapore stands out with a high number of branches, indicating active parallel development and experimental feature additions. This suggests diverse smart city-related trials are underway.
Japan and Estonia, though smaller in scale, exhibit distinctive improvement patterns. Japan has a relatively high number of contributors but fewer pull requests, suggesting potentially rigorous code review and integration processes. Estonia, with only 196 repositories, recorded approximately 6,000 pull requests, highlighting its highly efficient improvement cycle. Furthermore, the number of pull requests (1,058) significantly exceeds the number of issues, suggesting a tendency for reported problems to be resolved quickly. This indicates that Estonia likely has a development culture focused on intensive improvement activities for a small number of projects, prioritizing high improvement rates and rapid response.
The shape of the radar chart also clearly reveals each country's strategic characteristics. The UK and US are omnidirectional, excelling in all areas: scale, popularity, improvements, and personnel. France, on the other hand, leans heavily toward issues and pull requests, forming a developer community-driven improvement culture. Germany and Singapore show sharp peaks in specific metrics, indicating specialized, focused activities. Japan and Estonia are small-scale and efficiency-focused, likely influenced by differences in the timing of policy implementation and administrative structures.
-
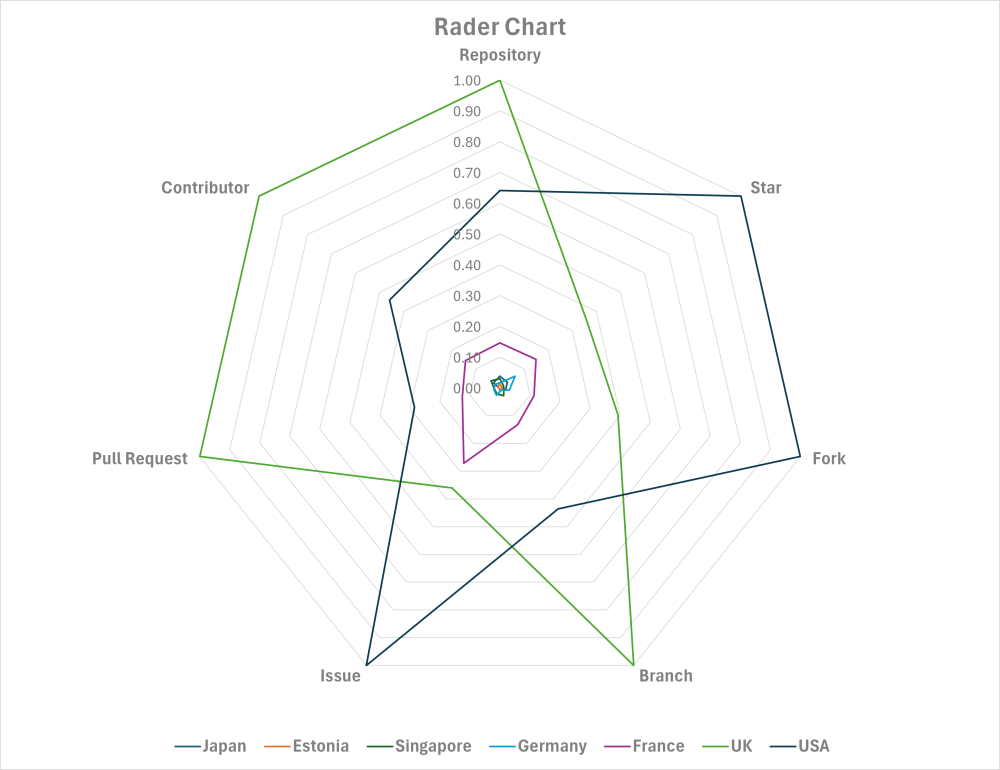
Figure 4-3 Radar Chart (7-Country Comparison)
-
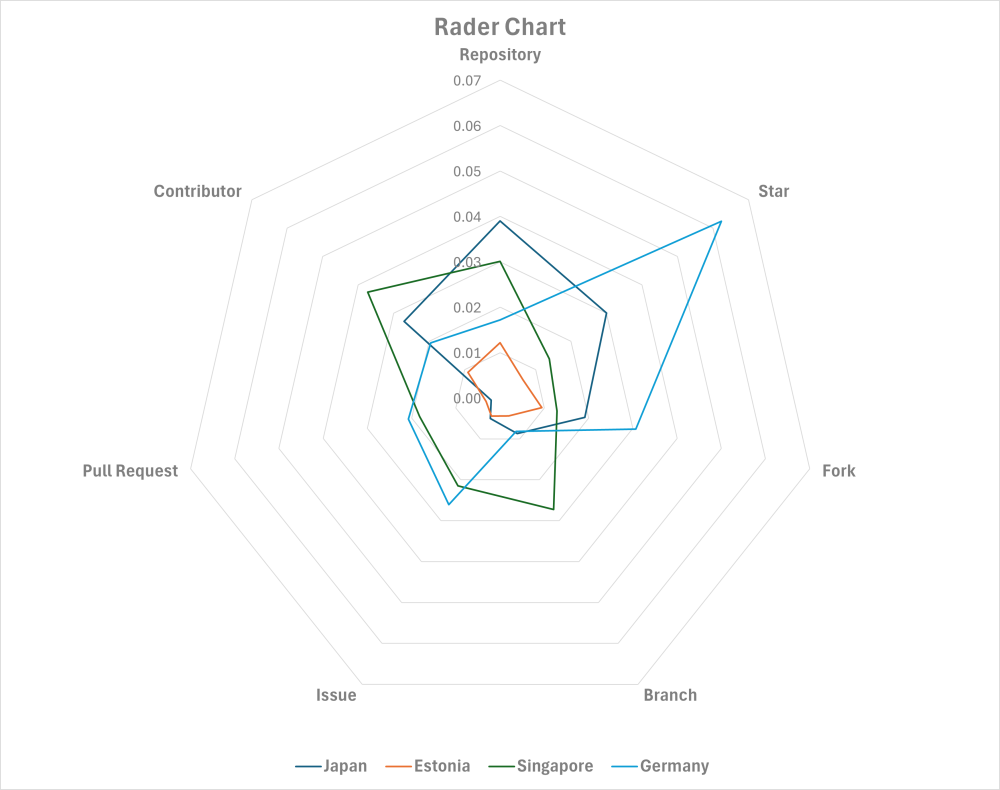
Figure 4-4 Radar Chart (4-Country Comparison)
4.3 Analysis 2: Analysis by Time Series
To understand the temporal evolution of OSS activities across countries, we aggregated the initial commit dates (publication dates) of OSS repositories and quantitatively calculated the annual number of OSS releases. Using initial commit dates enabled an objective analysis of the start dates of OSS activities by each government and the trends in the number of releases.
A simultaneous increase in policy implementation timing and OSS publication numbers was observed across multiple countries. However, numerous confounding factors exist, and establishing causality is beyond the scope of this edition.
Particularly in the UK, US, France, and Germany, OSS releases surged immediately after policy implementation, suggesting policies may have strongly contributed to activity activation. Conversely, cases like the US and Singapore show active OSS activity predating policies, indicating policies may also accelerate and institutionalize existing trends.
These trends suggest that institutionalizing and implementing policies in government OSS activities can have a significant impact on expanding activity volume and improving quality.
4.3.1 Japan
Japan has 22 GitHub organizations and 626 repositories, with OSS releases surging between 2013 and 2015. This increase is likely attributable to the government's push for openness following the 2012 e-Government Open Data Strategy and the 2013 Basic Policy on Open Data. Since 2018, the publication of the Digital Government Promotion Standard Guidelines via the Government CIO Portal has provided institutional backing for OSS utilization, leading to a steady increase in releases. The establishment of the Digital Agency in 2021 was a major turning point; the inclusion of "Open by Default" and "Cloud by Default" in its priority plans accelerated OSS releases. Since 2022, the number of releases has been steadily increasing. These trends suggest that policy-driven institutional support may be having an impact.
- Open Data Strategy (2012)
-
Promoted the disclosure and reuse of administrative information. Established the foundation for OSS utilization by fostering a trend toward openness.
- Government CIO Portal OSS Recommendations (Around 2018~)
-
Expanded OSS options in government procurement. Ensured transparency in technology selection through standard guideline sets.
- Establishment of the Digital Agency (2021)
-
Establishes foundations for promoting OSS utilization. Advances standardization and openness of government systems.
-
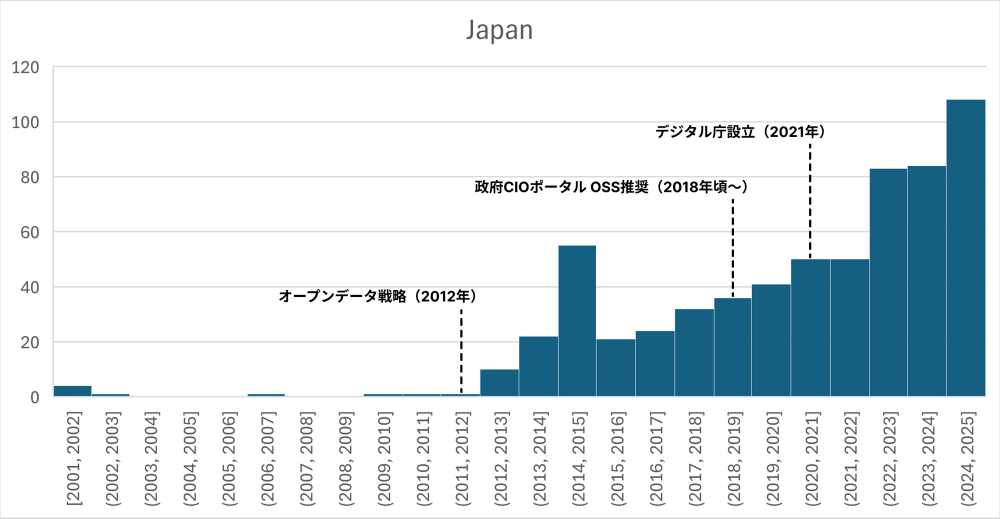
Figure 4-5 Annual trend in OSS repository releases (Japan)
4.3.2 Estonia
Estonia has 6 GitHub organizations and 196 repositories, with OSS releases increasing sharply since 2013.This growth is attributed to the "Digital Agenda 2020" formulated in 2013, which strengthened the digitization and openness of government services. The number of releases maintained a high level particularly from 2014 to 2017, influenced by the OSS release of X-Road (published on GitHub in 2014) and efforts to promote international reuse. Although there has been a slight downward trend since 2018, the number remains at a steady level. This is due to the continued use of OSS accompanying the expansion of e-Residency and cross-border services. These trends suggest that Estonia's digital policy strongly supports OSS releases, and particularly that international collaboration and the opening of public infrastructure contribute to the growth of the OSS ecosystem.
- Digital Agenda 2020 (2013)
-
Promotion of digital public services, including OSS.
- OSS release of X-Road (2016)
-
Release of X-Road (intergovernmental data exchange platform) as OSS. (Foundation of OSS strategy)
-
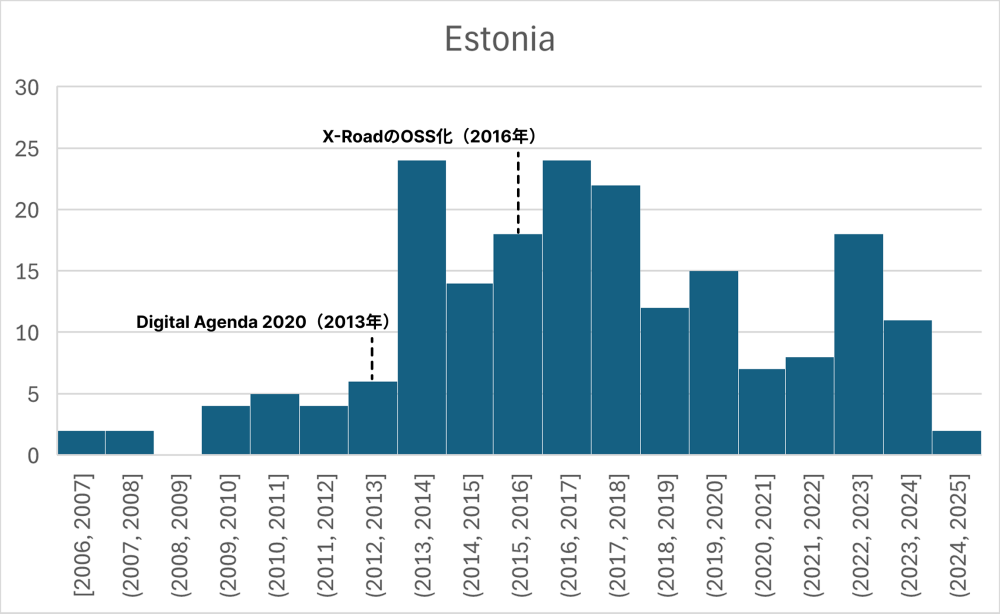
Figure 4-6 Annual trend in OSS repository releases (Estonia)
4.3.3 Singapore
Singapore has 5 GitHub organizations and 483 repositories. Its open-source software (OSS) releases surged sharply after 2015, peaking between 2017 and 2018. This surge is attributed to the Smart Nation policy launched in 2014 and the open-source promotion initiatives by GovTech since 2016. Notably, in 2017, the government significantly increased code releases on GitHub and strengthened collaboration with the developer community. While maintaining high levels since 2018, there has been a gradual decline, reflecting the completion of the initial large-scale releases. In 2020, the Singapore Government Developer Portal was launched, institutionally supporting OSS reuse and transparency. Since 2021, the number of releases has stabilized, remaining at a high level. These trends suggest that Singapore's digital policies strategically position OSS release to strengthen the nation's digital infrastructure.
- Smart Nation Policy (2014)
-
Promotes open technologies as the core of the national digitalization strategy.
- GovTech's OSS Strategy (around 2016–present)
-
Initiated GitHub publication of government code and strengthened collaboration with the developer community.
- Singapore Government Developer Portal (2020)
-
Promotes the publication and reuse of OSS libraries.
-
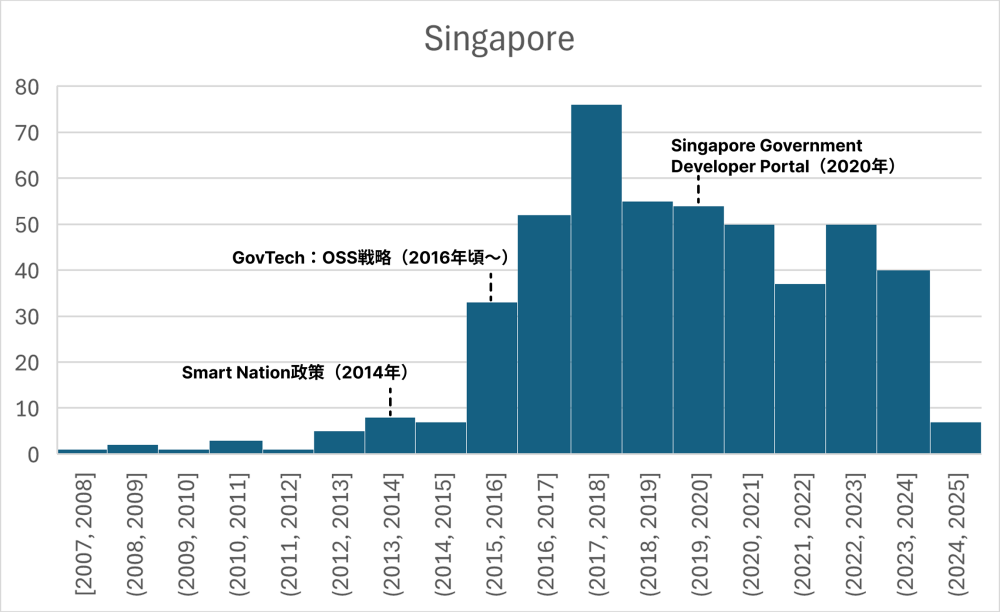
Figure 4-7 Annual trend in OSS repository releases (Singapore)
4.3.4 Germany
Germany has 8 GitHub organizations and 276 repositories. OSS releases have increased gradually since 2015, showing rapid growth since 2020. This surge is attributed to the federal government clarifying OSS's role in its digitalization strategy in 2019 and the announcement of the "Sovereign Tech Fund" initiative in 2021. The number of releases reached record highs from 2021 to 2023, influenced by the government positioning OSS as a key element for securing national digital sovereignty and introducing funding support and enhanced security measures. The 2022 formulation of the "Digital Strategy Germany," which explicitly promotes OSS usage and development support, also contributed to the increase in releases. While a slight decline was observed in 2024, the number remains at a high level, suggesting that institutional support through policy is influencing the growth of OSS activities.
- OSS explicitly stated in the Federal Government Digitalization Strategy (2019)
-
Clarified the policy for OSS use in government systems.
- Sovereign Tech Fund Initiative (2021)
-
Initiated funding specifically for security and maintenance support of OSS foundational technologies.
- Digital Strategy Germany (2022)
-
Incorporates promotion of OSS use and development support into national strategy.
-
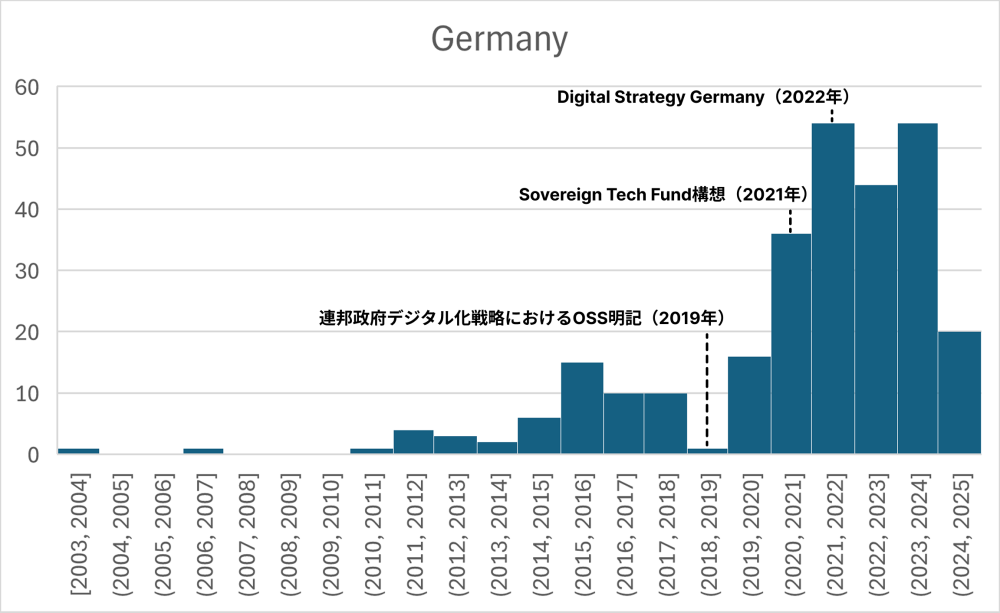
Figure 4-8 Annual trend in OSS repository releases (Germany)
4.3.5 France
France has 25 GitHub organizations and 2,359 repositories. OSS releases surged after 2012, showing significant growth from 2015 to 2018. This increase is likely attributed to the introduction of an OSS priority policy for government agencies following the 2012 "Circulaire Ayrault.” In 2016, Etalab strengthened initiatives to promote OSS reuse and established the foundation for government code disclosure, further influencing this trend. Since 2018, the number of releases has stabilized at a high level, peaking between 2021 and 2022. This peak resulted from the institutionalization of government source code disclosure through the launch of Code.gouv.fr. While a slight decline has been observed since 2023, the number remains at a high level, suggesting that French policy may be having a long-term impact on the growth of the OSS ecosystem.
- Circulaire Ayrault (2012)
-
Introduced a policy prioritizing OSS use within government agencies.
- Promotion of OSS reuse by Etalab under the Digital Republic Act (around 2016~)
-
Promotes the sharing and reuse of public code.
- Launch of Code.gouv.fr (2021)
-
Institutionalized the publication of government source code and improved transparency.
-
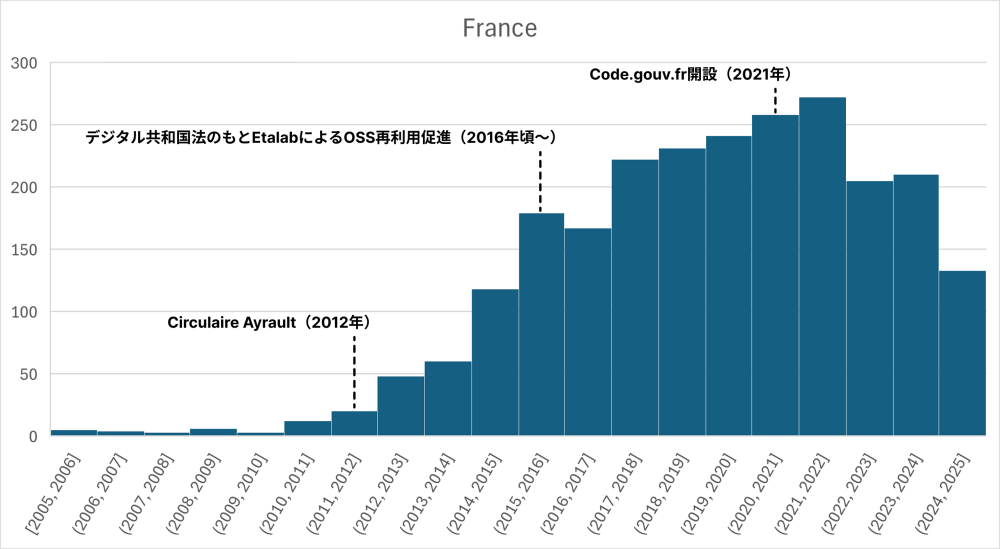
Figure 4-9 Annual trend in OSS repository releases (France)
4.3.6 United Kingdom
The UK has 30 GitHub organizations and 16,058 repositories. OSS publication numbers showed gradual growth until the early 2010s but grew rapidly after 2013, peaking between 2017 and 2018. This surge is likely attributable to the establishment of the Government Digital Service (GDS) in 2012, which introduced Digital Service Standards and an open-source utilization policy. Furthermore, the "Open Standards Principles" formulated that same year institutionalized the adoption of open technologies in government systems. From 2016 onward, the expansion of the GOV.UK platform and increased publication on GitHub helped maintain a high level of OSS releases. While a slight decline has been observed since 2020, the level remains high, suggesting that UK policy may be having a long-term impact on the growth of the OSS ecosystem.
- Establishment of the Government Digital Service (2012)
-
Introduced standardization and OSS utilization policies for Government Digital Services.
- Open Standards Principles (2012)
-
Emphasized open standards and OSS compatibility in government IT.
- GOV.UK Platform Expansion (circa 2016–)
-
Promoting OSS-based service development and code publication on GitHub.
-
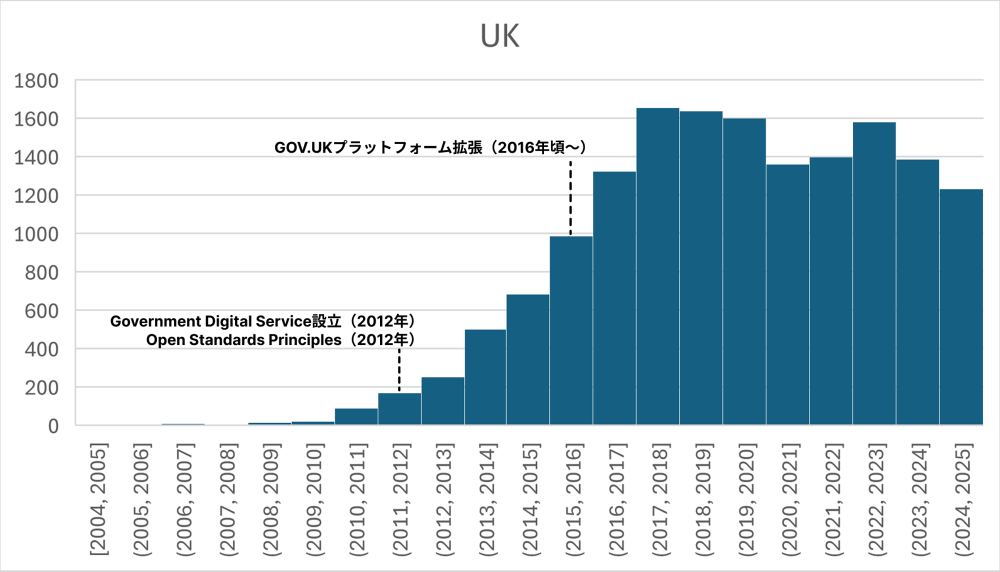
Figure 4-10 Annual trend in OSS repository releases (UK)
4.3.7 United States
The US has 71 (GitHub) organizations and 10,300 repositories, with OSS releases increasing sharply since 2016. This growth is likely due to the introduction of the "Federal Source Code Policy" announced in 2016, which mandated that over 20% of government-developed code be released as OSS. The launch of Code.gov in 2017 institutionalized the aggregation and reuse of government code, accelerating OSS publication. Since 2020, the number of releases has remained at a high level. In 2022, OMB M-22-18 explicitly mandated enhanced security management for OSS, promoting improved reliability and continued release. These policies, aimed at transparency and innovation promotion, suggest a potential long-term impact on the growth of the OSS ecosystem.
- Federal Source Code Policy (2016)
-
ntroduced a policy to release over 20% of government code as OSS.
- Launch of Code.gov (2017)
-
Promoted the aggregation and reuse of government OSS.
- OMB M-22-18 (2022)
-
Mandates enhanced security management for OSS.
OMB: Office of Management and Budget (U.S. Administrative Management and Budget Bureau)
-
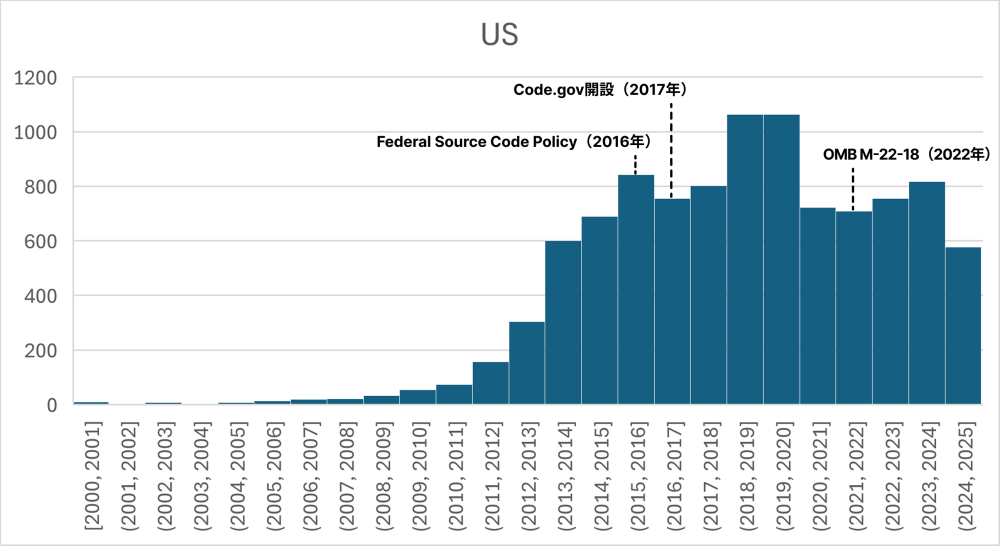
Figure 4-11 Annual trend in OSS repository releases (United States)
4.4 Analysis 3: Classification by Technology Field and Trend Identification
This analysis attempts to organize OSS repositories published by various governments by technical field and provide an overview of activity trends. The objective is to understand the publication status of government-related OSS by field, identify areas where development is active, and clarify noteworthy technical fields. While these results are experimental and exploratory in nature, they serve as a starting point for gaining a more detailed understanding of key focus areas for administrative OSS.
For this analysis, OSS repositories were classified into the following six fields:
- Data Infrastructure & APIs
- Government Services
- Security
- Maps and Urban Information
- Smart Cities
- Education, Healthcare, and Welfare
Classification is performed automatically based on keywords contained in repository names and project names, with the following six fields defined. Detailed classification methods and keyword lists are provided in the Appendix.
Note that this classification is an estimation based on repository names and is technically prone to error; it does not involve specialized verification. Many OSS repositories use proper nouns or neologisms, and often lack keywords indicating a technical field, resulting in a very high number of repositories classified as "Other." "Other" includes OSS with general-purpose functions, such as development tools, and unclassified repositories.
This attempt is an exploratory organization to grasp trends by field, not a strict technical classification. We believe that adding more precise classification and expert review in the future will enable a more accurate understanding of the key areas for administrative OSS.
| Category | Repository |
|---|---|
| Administrative Services | 2340 |
| Data Infrastructure/API | 1935 |
| Maps & Urban Information | 443 |
| Education, Healthcare, Welfare | 278 |
| Smart City | 54 |
| Security | 38 |
| Other(Development Tools) | 10934 |
| Other(Uncategorized) | 13950 |
-
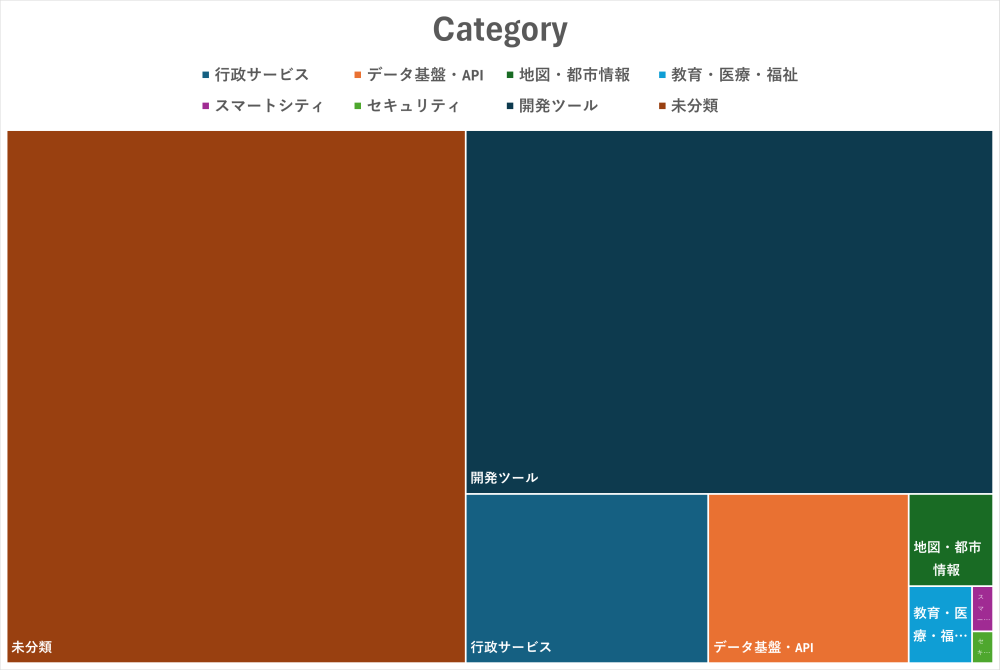
Figure 4-12 Classification by Technology Field Across OSS Repositories in 7 Countries (Treemap)
4.4.1 Trends by Category
-
(1) Administrative Services (2,340 entries)
Many OSS projects supporting the digitization of administrative procedures—such as public services, e-applications, and dashboards—are published. These include frontend UI, design guidelines, application form generation tools, and administrative dashboards. As they directly enhance the convenience of administrative services and improve operational efficiency, they stand out in both quantity and importance. -
(2) Data Infrastructure & APIs (1,935 items)
This core area for government digitalization and data integration strategies primarily features OSS related to API platforms, data integration, and standardization. Representative examples include API gateways, data integration platforms, and API documentation generation tools, which function as foundational infrastructure for administrative services and other sectors. This OSS constitutes critical technology supporting data sharing between government agencies and the integration of public services.
-
(3) Maps & Urban Information (443 items)
This field includes OSS related to geospatial information and urban planning, focusing on 3D city models, map APIs, and visualization tools. Examples include GIS data conversion tools and urban structure simulations, which are being utilized to advance smart cities and urban planning.
-
(4) Education, Healthcare, and Welfare (278 items)
This is an area where OSS adoption is challenging due to handling personal and sensitive information, though limited releases exist. Representative examples include school choice support tools and medical data verification APIs, contributing to educational support and the digitization of healthcare services.
-
(5) Smart Cities (54 items)
Includes OSS related to urban infrastructure, traffic control, and smart services. While the number of projects is limited, representative examples include urban traffic management systems and smart infrastructure integration tools. These technologies are increasingly important for enhancing urban sustainability and efficiency.
-
(6) Security (38 items)
Though the number of projects is small, this is an essential area for ensuring the reliability of e-government. It includes OSS aimed at authentication, encryption, and privacy protection, with representative examples being single sign-on (SSO), electronic signatures, and encryption libraries. While the number of releases is limited, their qualitative importance is extremely high.
4.4.2 Development Tools
The release of government-related OSS extends beyond technical fields like administrative services and data infrastructure to encompass tool sets supporting development and operations. This movement addresses needs such as improving government system development efficiency, quality assurance, security enhancement, and cloud migration, making it a core element of the digital government strategy.
In particular, the adoption of OSS for CI/CD, operational automation, testing/quality assurance, and development support tools is crucial as a mechanism enabling the rapid delivery and continuous improvement of government services.
(1) Overview of Published Development Tools
The publicly available development tools cover a wide range, with the main categories listed below.
- CI/CD and Build-Related Tools
-
Numerous OSS tools supporting continuous integration and deployment, such as Jenkins, GitHub Actions, and Terraform, are publicly available. This enables rapid updates and improvements to government services.
- Operational Automation and Infrastructure Management
-
Tools like Ansible, Docker, and Kubernetes are included to streamline the construction and management of cloud and on-premises environments. These are essential for ensuring the scalability and stability of government systems.
- Development Assistance and Utilities
-
OSS tools that enhance developer productivity, such as code generation, templates, SDKs, and sample code, are publicly available. This improves standardization and reusability in the development process.
- Testing and Quality Assurance
-
Includes OSS supporting quality management, such as automated testing, mocking, and QA tools. These play a crucial role in ensuring the reliability of government services.
- UI Components & Visualization
-
OSS that contributes to usability improvement, such as React- and Vue-based UI components and dashboards, is publicly available.
- Security Support Tools
-
Includes OSS aimed at strengthening security, such as vulnerability scanners, authentication modules, and encryption libraries.
(2) Relationship Between Development Tools and Technical Fields
These development tools serve as the foundation supporting OSS development in technical fields.
In the administrative services domain, CI/CD and UI components enable rapid service updates and usability improvements.
In the data infrastructure and API domain, API testing tools and data conversion tools ensure reliability and compatibility.
In the security domain, vulnerability detection and authentication modules guarantee safety.
In the smart city and geographic information sector, visualization tools and GIS-related plugins promote the utilization of urban data.
The open-source release of development tools is not merely a supplementary activity but an essential element in the government's digitalization strategy.
- Development Efficiency: CI/CD and templates shorten the development cycle.
- Quality Assurance: Service reliability improves through test automation.
- Security Enhancement: Vulnerability detection and authentication modules enable secure service provision.
- International Reusability: Publishing as OSS enables use by other countries and private companies, contributing to ecosystem expansion.
Government organizations overwhelmingly publish OSS in the areas of administrative services and data infrastructure/APIs, driving government digitalization. Maps and urban information demonstrate significant presence as the foundation for urban digitalization. Education, healthcare, and welfare face limitations due to sensitive information constraints, resulting in restricted publication, yet their social impact remains substantial. Security and smart cities, though fewer in number, are critical areas directly linked to e-government reliability and urban sustainability.
This analysis reveals that the release of government-related OSS is not merely a technical offering, but a strategic initiative directly linked to enhancing administrative transparency, efficiency, and the quality of citizen services.
4.5 Summary of Analysis
The results of this analysis suggest that each country's OSS activities reflect differences in the timing of policy introduction and institutional design, indicating that historical background likely strongly influences current activity characteristics. Countries that introduced policies early stand out in multiple metrics, including the number of repositories and pull requests, demonstrating high maturity in both activity scale and improvement cycles. Conversely, later adopters, while smaller in scale, tend to focus on efficient improvement activities in specific domains and prioritize rapid issue resolution.
A radar chart providing an overview of international comparisons revealed each country's strategic characteristics. The UK and US are omnidirectional, excelling in scale, popularity, improvement, and personnel. France is developer community-driven, heavily weighted toward issues and pull requests, with a mature collaborative development culture. Germany and Singapore show sharp peaks in specific metrics, pursuing specialized, field-focused activities. Japan and Estonia are small-scale and efficiency-focused, characterized by a development culture emphasizing improvement rates and speed. These differences do not indicate superiority or inferiority but rather reflect diverse approaches adopted according to each country's specific environment.
Meanwhile, exploration analysis focused on technical domains reveals that government organizations overwhelmingly publish OSS in the areas of administrative services and data infrastructure/APIs, demonstrating OSS's contribution to national DX efforts. Maps and urban information maintain a significant presence as the foundation for urban digitalization. Education, healthcare, and welfare face limitations due to sensitive information constraints, resulting in restricted releases, yet their social impact remains substantial. Security and smart cities, while fewer in number, are critical areas directly linked to e-government reliability and urban sustainability.
Regarding the release of OSS development toolkits, these form the core of the government-related OSS ecosystem and are suggested to be key to accelerating OSS releases in technical fields. CI/CD, operations automation, testing/quality assurance, and development support tools are indicated to enable rapid development and operation of administrative services and data infrastructure while ensuring quality and security.
Based on these analyses, the release of government-related OSS is considered a strategic initiative that goes beyond mere technology provision, directly contributing to administrative transparency, efficiency, and improved quality of citizen services.